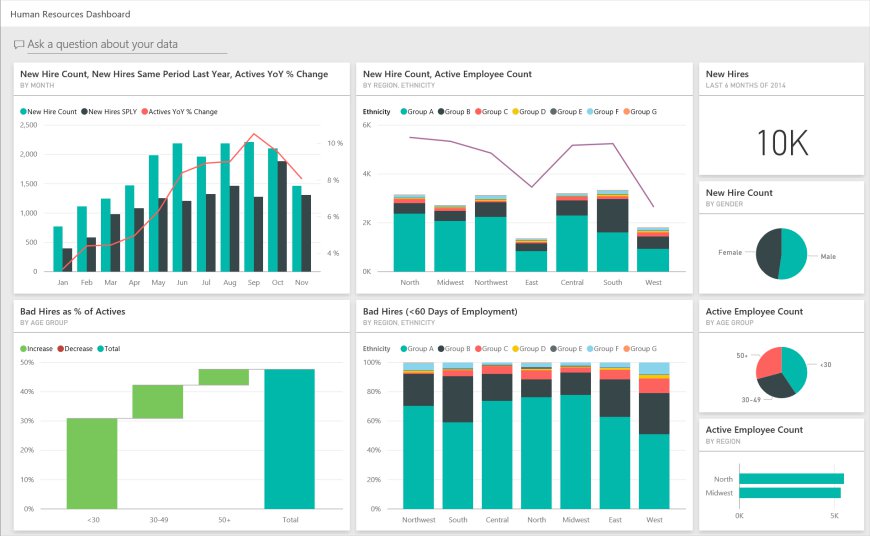
Exploring Power BI KPI Dashboard Examples for Marketing Campaigns

In the dynamic world of marketing, data-driven decision-making is crucial for success. Marketing teams are inundated with data from various channels, and to extract actionable insights, they require robust tools. Microsoft Power BI is one of the leading business intelligence solutions that enable marketers to create comprehensive dashboards. In this article, we’ll explore Power BI KPI dashboard examples specifically designed for marketing campaigns, showcasing how they can provide valuable insights into performance and strategy optimization.
The Importance of KPI Dashboards in Marketing
Key Performance Indicators (KPIs) are measurable values that demonstrate how effectively a company is achieving its key business objectives. In marketing, KPIs can help teams track their progress towards goals, optimize campaigns, and make informed decisions. A Power BI KPI dashboard provides a visual representation of these metrics, allowing marketers to monitor performance in real time.
Benefits of Using Power BI for Marketing KPI Dashboards:
- Visual Data Representation: Power BI transforms complex data into intuitive visuals, making it easier to understand trends and patterns.
- Real-Time Analytics: With live data connections, marketing teams can react swiftly to changes in campaign performance.
- Integration: Power BI allows seamless integration with various data sources, including social media platforms, CRM systems, and web analytics tools.
- Customizable Reports: Marketers can tailor dashboards to focus on specific KPIs that align with their strategic objectives.
Power BI KPI Dashboard Examples for Marketing Campaigns
1. Campaign Performance Dashboard
This dashboard provides a comprehensive overview of all active marketing campaigns. It typically includes KPIs such as:
- Impressions and Reach: Track how many people viewed the campaign.
- Click-Through Rate (CTR): Measure the effectiveness of calls to action.
- Conversion Rate: Evaluate the percentage of users who completed a desired action.
Example Insight: By analyzing which campaigns yield the highest conversion rates, marketers can replicate successful strategies and allocate resources more effectively.
2. Social Media Performance Dashboard
Social media is a vital channel for marketing, and this dashboard focuses on metrics such as:
- Engagement Metrics: Likes, shares, comments, and overall engagement rates.
- Follower Growth: Monitor the increase in followers across different platforms.
- Traffic Sources: Identify which social platforms drive the most traffic to your website.
Example Insight: This dashboard enables marketers to identify which content resonates most with their audience, allowing for tailored social media strategies.
3. Email Marketing Dashboard
Email marketing remains a powerful tool for engagement. An email marketing dashboard can include:
- Open Rates: Percentage of recipients who opened the email.
- Click Rates: Percentage of recipients who clicked on links within the email.
- Unsubscribe Rates: Track how many recipients opted out after receiving your email.
Example Insight: By analyzing these KPIs, marketers can refine their email content and targeting strategies to improve overall engagement and reduce unsubscribe rates.
4. Customer Acquisition Dashboard
This dashboard focuses on the effectiveness of customer acquisition strategies, tracking metrics such as:
- Cost Per Acquisition (CPA): Understand how much it costs to acquire a new customer.
- Lead Conversion Rates: Measure how many leads convert into paying customers.
- Source of Leads: Analyze which channels provide the highest quality leads.
Example Insight: Marketers can determine which acquisition channels yield the best ROI, enabling them to invest more strategically.
5. Web Traffic Analysis Dashboard
Understanding how users interact with your website is crucial. A web traffic analysis dashboard might include:
- Total Visitors: Track the number of unique visitors to your site.
- Bounce Rate: Measure the percentage of visitors who leave after viewing only one page.
- Session Duration: Understand how long visitors stay on your site.
Example Insight: This dashboard can highlight areas for website optimization, such as improving landing pages to reduce bounce rates.
Creating Your Own Power BI KPI Dashboard for Marketing
When designing a Power BI KPI dashboard for your marketing campaigns, consider the following best practices:
-
Define Clear Objectives: Establish what you want to achieve with the dashboard. Focus on KPIs that align with your marketing goals.
-
Select Relevant Metrics: Choose KPIs that provide insight into your campaign's performance. Avoid clutter by limiting the number of metrics displayed.
-
Use Visuals Effectively: Power BI offers various visualizations such as bar charts, line graphs, and pie charts. Use these to highlight trends and comparisons.
-
Keep it Interactive: Incorporate filters and slicers to allow users to explore the data dynamically and gain deeper insights.
-
Ensure Data Accuracy: Always verify the data source and ensure that the information is up-to-date to maintain trust in your dashboard.
Conclusion
Power BI KPI dashboards are essential tools for marketers looking to harness the power of data in their campaigns. By visualizing critical KPIs, marketing teams can monitor performance, adapt strategies, and make informed decisions in real time. The examples provided highlight how Power BI can be tailored to meet the specific needs of various marketing functions, from campaign performance to social media engagement. As the marketing landscape continues to evolve, leveraging powerful analytics tools like Power BI will be crucial for staying ahead of the competition and achieving long-term success.
FAQs
1. What are KPIs, and why are they important in marketing?
KPIs are measurable values that indicate how effectively a company is achieving its business objectives. In marketing, KPIs help track performance and guide decision-making.
2. How can I integrate Power BI with my existing marketing tools?
Power BI allows integration with various data sources, including social media platforms, CRM systems, and web analytics tools, enabling seamless data flow.
3. Can I customize Power BI dashboards for different marketing teams?
Yes, Power BI dashboards can be customized to focus on specific KPIs and metrics relevant to different marketing teams or campaigns.
4. How often should I update my Power BI marketing dashboards?
Dashboards should be updated regularly, ideally in real-time, to reflect the latest data and performance metrics.
