

HPLC Tested MOTS-c: A Guide to Understanding Laboratory Data Tables

Laboratory testing helps researchers understand the composition and quality of research peptides. When looking at HPLC tested MOTS-c, it is important to know what the testing measures, how to read the results, and what the numbers in a laboratory report actually mean. Understanding these details can make it easier to review testing documents and assess the information they provide.
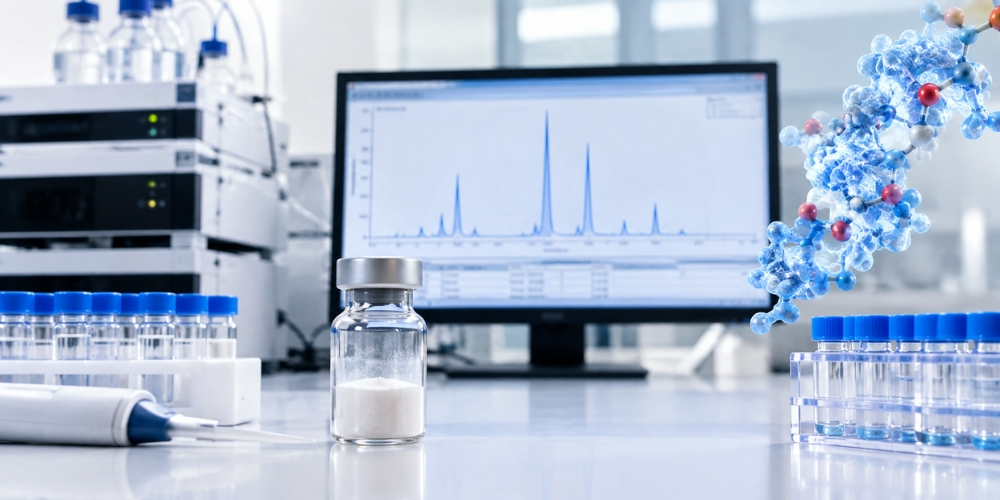
High-performance liquid chromatography, commonly known as HPLC, is an analytical technique used to separate the components of a sample. Laboratories use this method to examine a sample's composition and estimate its chromatographic purity. The results are usually presented as a graph called a chromatogram, along with a data table containing measurements such as retention time, peak area, and area percentage.
Although these terms may seem technical at first, each one provides useful information about the analysis. By understanding the basic principles behind them, readers can interpret laboratory reports more confidently and recognise the limitations of the results.
What Is MOTS-c?
MOTS-c is a peptide derived from mitochondrial genetic material. It has attracted scientific interest because of its possible role in cellular metabolism and energy regulation. Researchers study it to better understand how mitochondria may influence metabolic processes and other aspects of cellular function.
As research into MOTS-c continues, laboratory analysis remains important for examining the characteristics of samples used in scientific studies. Researchers may need information about a sample's composition, purity, stability, and molecular properties before drawing conclusions from experimental results.
A label stating that a sample contains MOTS-c does not independently confirm its identity or composition. Laboratory testing can provide supporting evidence, but the strength of that evidence depends on the analytical methods used and the quality of the report.
Understanding HPLC tested MOTS-c results is therefore useful for anyone who wants to learn how laboratory data is presented and what it can reasonably establish.
What Does HPLC Testing Mean?
High-performance liquid chromatography is a laboratory technique that separates the components of a mixture. During the process, a liquid sample passes through a column containing a stationary material. Different substances interact with this material in different ways, causing them to travel through the column at different rates.
As the separated components leave the column, a detector measures their signals. The instrument records these signals and displays them as peaks on a chromatogram.
Each peak represents a detected component or signal under the conditions used for the analysis. The position, size, and shape of a peak can help analysts understand the sample's chromatographic profile.
For HPLC tested MOTS-c, this information may help estimate how much of the detected signal is associated with the main component compared with other detected components.
However, HPLC does not automatically confirm every aspect of sample quality. Additional testing may be needed to establish molecular identity, absolute peptide content, biological activity, or the presence of specific contaminants. The results should always be interpreted according to the purpose and limitations of the analytical method.
Understanding the Main Sections of an HPLC Data Table
An HPLC report often includes a table that summarises the peaks identified during testing. Although the layout can vary between laboratories, several measurements commonly appear.
1. Peak Number
The peak number identifies each signal recorded during the analysis. A data table may list Peak 1, Peak 2, Peak 3, and other peaks in the order they appear.
These numbers help readers match the information in the table with the corresponding signals on the chromatogram. They do not identify the chemical substance represented by each peak.
The main peak may be associated with the expected target compound, while smaller peaks may represent other sample components, degradation products, or analytical artefacts. Further investigation is needed to determine the source of an individual peak.
2. Retention Time
Retention time is the amount of time a component takes to travel through the chromatographic system and reach the detector. It is generally measured in minutes.
Different compounds may have different retention times under the same analytical conditions. Analysts can compare a sample's retention time with that of a suitable reference material to help assess whether the results are consistent with the expected compound.
However, retention time alone cannot conclusively establish identity. Different substances may appear at similar times, and changes in the column, temperature, mobile phase, or instrument settings can affect the measurements.
When reviewing HPLC tested MOTS-c results, retention time should therefore be considered alongside other evidence rather than treated as proof of identity.
3. Peak Area
Peak area represents the total detector signal measured across a chromatographic peak. It is calculated by integrating the signal over the peak's duration.
A larger peak area generally indicates a stronger detector response under the conditions used. Laboratories often use peak areas to calculate the relative proportions of detected components.
However, detector response can differ between substances. Two components present in similar amounts may produce different peak areas because they interact differently with the detector.
For this reason, peak area should be interpreted according to the analytical method and the calculations described in the report.
4. Peak Height
Peak height measures the maximum signal intensity reached by a peak. Unlike the peak area, it focuses on the highest point rather than the total signal across the peak.
Peak height can help analysts compare signals, but it is affected by peak width, separation conditions, and detector settings. Two peaks with similar heights may have different areas if one is wider than the other.
Both measurements can be useful, but their importance depends on the analytical method and the purpose of the test.
5. Area Percentage
Area percentage is one of the most commonly reported values in an HPLC data table. It represents the area of an individual peak as a percentage of the total integrated area included in the calculation.
For example, a hypothetical report may show a main peak with an area percentage of 97%. This means that the peak accounts for 97% of the total integrated peak area used in the calculation.
It does not automatically mean that the sample contains 97% MOTS-c by weight.
Some substances may not be detected effectively under the selected conditions. Other components may overlap with the main peak, and differences in detector response can affect the calculation.
As a result, area percentage is generally best understood as a measure of chromatographic purity rather than a direct measurement of absolute peptide content.
How to Read an HPLC Chromatogram
A chromatogram provides a visual summary of the signals recorded during HPLC testing. The horizontal axis usually represents retention time, while the vertical axis shows the detector response.
Each peak represents a detected signal. Its position indicates when the signal appeared, while its size provides information about the detector response.
When examining a chromatogram, several features deserve attention.
-
Main peak: The largest peak may correspond to the expected compound, provided its identity is supported by appropriate evidence.
-
Additional peaks: Smaller peaks may indicate other components, impurities, degradation products, or analytical artefacts.
-
Peak separation: Clearly separated peaks make it easier to distinguish and measure individual components.
-
Baseline: A stable baseline helps analysts identify peaks and distinguish them from background noise.
-
Peak shape: Unusual shapes may indicate separation problems, sample interactions, or other analytical issues.
The chromatogram should always be reviewed alongside the data table and the method description. A large main peak may indicate that one component dominates the detected signal, but it does not independently confirm the identity or exact quantity of that component.
What Does a High Purity Result Mean?
A high chromatographic purity result generally indicates that a large proportion of the integrated detector response comes from one dominant peak. This can be useful when reviewing a sample's analytical profile.
For example, an HPLC tested MOTS-c report may show a main peak accounting for most of the total measured area, with only a few smaller peaks. This suggests that the sample has a dominant chromatographic component under the conditions used.
However, a high percentage should not be treated as a complete measure of quality.
Chromatographic purity and peptide content are different measurements. Purity describes the distribution of detected signals according to the analytical method, while content refers to the amount of the target substance in the sample.
Determining the actual amount of MOTS-c may require a validated quantitative method, appropriate reference standards, and suitable calibration procedures.
Likewise, HPLC purity results do not automatically establish sterility, endotoxin levels, residual solvent content, heavy metal levels, or biological activity. Separate tests may be needed to investigate these characteristics.
Understanding this distinction helps readers avoid placing more weight on a single laboratory result than the evidence supports.
Why the Laboratory Method Matters
The analytical method used for testing has a direct influence on the results. Two reports may show similar purity percentages while relying on different testing conditions.
Important method details include the column type, mobile phase, flow rate, detection wavelength, sample preparation, and instrument settings. These factors affect how components separate and how their signals are measured.
A useful report should also identify the sample and provide a testing date or another traceable reference. This information helps readers determine which material was tested and whether the results relate to the sample being evaluated.
Reference materials can provide additional evidence when comparing retention times and other analytical measurements. Where confirmation of molecular identity is required, techniques such as mass spectrometry may offer further information about molecular mass and composition.
Clear documentation, suitable method validation, and traceable sample handling also contribute to the reliability of laboratory findings. Without this supporting information, it can be difficult to judge how confidently the results support the claims being made.
Common Mistakes When Interpreting HPLC Results
Reading laboratory reports without understanding the underlying measurements can lead to several common errors.
One mistake is treating area percentage as absolute purity. Area percentage reflects the detected signals included in the calculation and may not represent the exact mass fraction of the target compound.
Another mistake is assuming that the largest peak proves molecular identity. Although a dominant peak may be consistent with the expected compound, additional evidence may be necessary to confirm what it represents.
Ignoring smaller peaks can also be misleading. A minor peak may be unimportant, but its significance depends on the substance involved, its concentration, and the purpose of the analysis.
Comparing reports without considering their analytical methods is another source of confusion. Different testing conditions may produce results that cannot be compared directly.
Finally, relying on a single test to establish overall quality overlooks the limits of HPLC. The technique provides valuable information about a sample's chromatographic profile, but it does not replace every other analysis needed to characterise a research peptide.
What to Check in an HPLC Tested MOTS-c Report
When reviewing an HPLC tested MOTS-c report, begin by checking whether the sample is clearly identified and whether the laboratory has provided the testing date and analytical method.
Look for the chromatogram and its accompanying data table. Review the retention times, peak areas, and area percentages, and check how the laboratory calculated chromatographic purity.
It is also important to determine whether the report provides evidence supporting the identification of the main peak. If it makes claims about exact peptide content or the absence of particular contaminants, check whether the documented testing methods can support those conclusions.
A complete report should provide enough information to understand how the results were obtained and what they represent. A single purity percentage without supporting data offers less insight than a report that includes the chromatogram, method details, and traceable sample information.
Taking time to review these details allows readers to assess laboratory findings more objectively and distinguish measured results from assumptions.
Final Thoughts
Understanding HPLC laboratory data tables makes it easier to interpret analytical information about research peptides. Measurements such as retention time, peak area, peak height, and area percentage each provide a different view of the sample's chromatographic profile.
When reviewing HPLC tested MOTS-c results, it is important to consider these measurements together with the chromatogram, testing method, and supporting documentation. A high purity percentage may indicate a dominant detected component, but it does not automatically confirm molecular identity, exact peptide content, or overall safety.
For readers seeking further information about research peptides and related laboratory testing, Gold Label Peptides provides a dedicated website where product information and available testing documentation can be reviewed. Understanding what laboratory reports measure can help readers assess this information more carefully and recognise the difference between a stated product specification and evidence supported by analytical results.
Ultimately, interpreting HPLC tested MOTS-c data requires attention to detail and an understanding of the limits of the method. By reviewing the main measurements, checking the supporting documentation, and avoiding assumptions based on a single number, readers can develop a clearer and more balanced understanding of laboratory findings.















Comments (0)